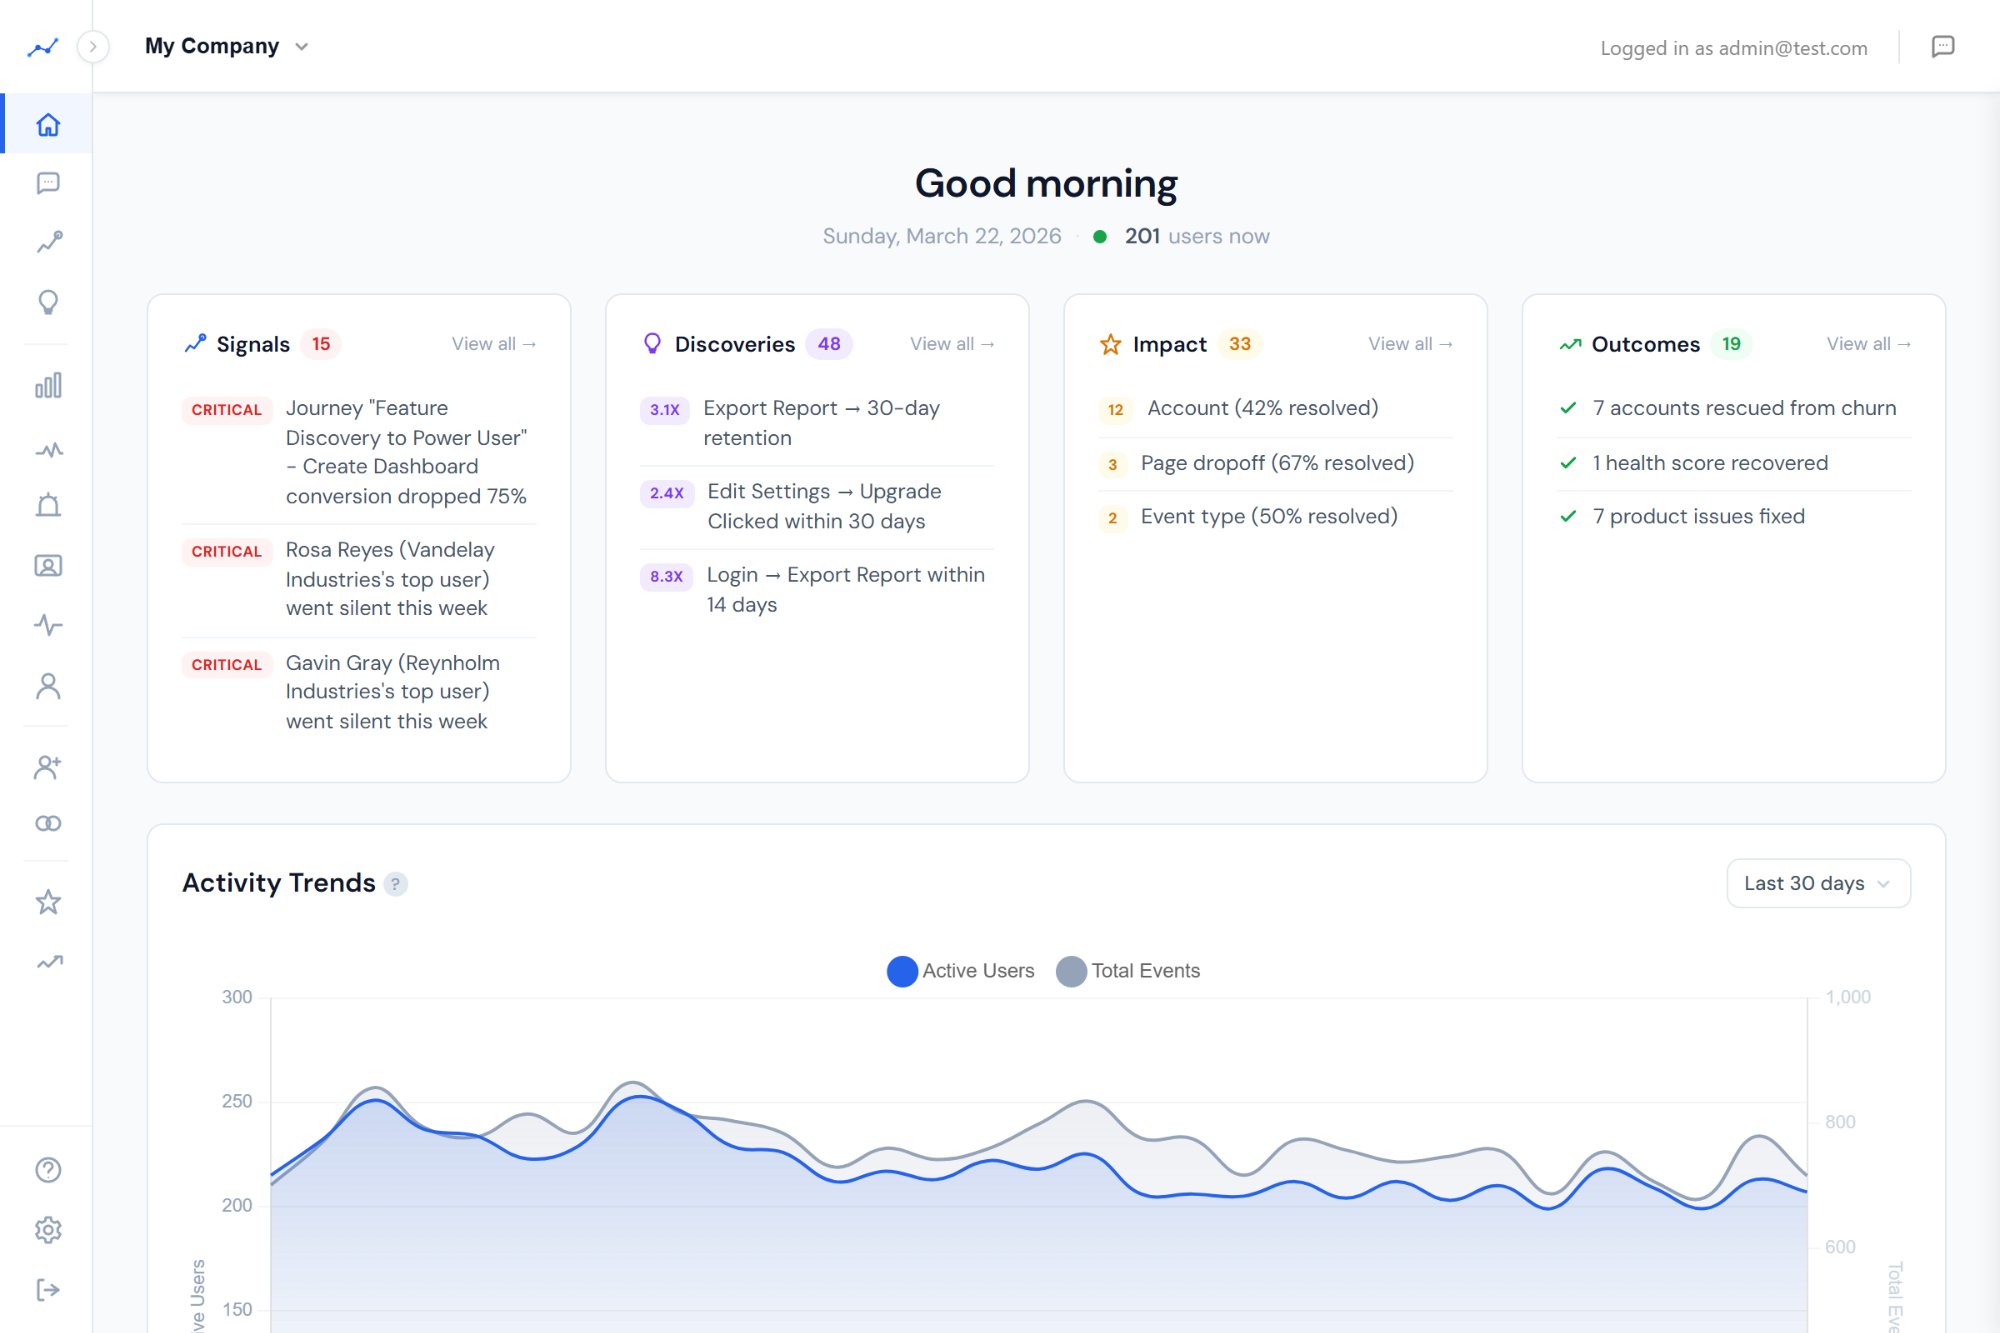
Complete Analytics Suite

Every report your
product team expects.

Trends, funnels, retention, paths, segments, real-time, and more. These aren't just dashboards - they're the data layer that Signals reads from, Discoveries mines, and Ask Prody queries. The analytics have to be right for the AI to be right.

Your dashboard.

Everything that matters at a glance. Activity trends with dual-axis charting, top accounts table, live users widget, top signals preview, and account health summary. Filter by time range, segment, account, or user - and every other page inherits the same filters.

  • Dual-axis activity chart (users + events)
  • Top 10 accounts with search and export
  • Live users count with sparkline
  • Top signals preview with direct action buttons
Prody Dashboard - activity trends, top signals, accounts

Eight report types. Zero compromises.

Every report your team runs in Mixpanel or Amplitude, Prody has. Built from scratch with B2B context baked in - accounts, segments, and global filters on everything.

📈

Trends

Chart any event over time. Filter by property, break down by dimension. Daily, weekly, or monthly granularity.

🎯

Funnels

Multi-step conversion analysis. Define any sequence of events, see where users drop off. Compare funnels across segments.

🔄

Retention

Cohort curves and grids. Configurable start and return events. See which behaviors predict long-term engagement.

🛤️

Path Analysis

Sankey diagrams showing user journeys. See the most common paths through your product and where users diverge.

🚀

Feature Adoption

Usage tiers (power, regular, casual, dormant) per feature. Adoption rates, trend lines, and drill-down to individual users.

⚠️

Error Tracking

JS errors, API errors, 404s. Stack traces, affected user counts, and trend charts. Catch broken experiences before users report them.

🔍

Explorer

Flexible event+property queries. "Show me users who did X but not Y in the last 14 days." SQL-level power, zero SQL.

⚖️

Comparison

Side-by-side feature or funnel comparisons. Spot differences between segments, time periods, or product areas.

↑ These reports feed → Signals, Discoveries, Ask Prody, MCP ↓

Build once, use everywhere.

Segments aren't just a list - they're the connective tissue of the entire platform. Build a segment once and it filters every report, scopes Signals, powers Discoveries, and feeds into exports. Organize them in folders so your team can find what they need.

  • 8 filter types: event count, property, first seen, last seen, account, industry, company size, custom
  • AND/OR logic with auto-estimating size before creation
  • Folder system for organization (by team, by use case, by product area)
  • Segment comparison tool - overlap analysis between any two segments
  • Global filters - apply any segment to any report with one click
Prody Segment Builder with folders

Save it. Share it. Come back to it.

Every analytics page supports saved views. Configure your filters, time range, and breakdown - then save it as a named view with a shareable deep link. Your team stops recreating the same report every Monday morning.

  • Save any report configuration as a named view
  • Shareable deep links - send a colleague the exact view you see
  • Quick-switch dropdown on every analytics page
  • Available on Trends, Funnels, Retention, Paths, Adoption, and Explorer
Prody Saved Views on Path Analysis

The features your previous tool didn't have.

Most analytics tools give you dashboards and call it done. Prody gives you control over your data - naming, visibility, properties, identity, and compliance. This is where teams stop evaluating and start committing.

🔗

Identity Resolution

Anonymous visitors merge with identified users automatically when they log in. One user, one timeline, no duplicates.

🏷️

Custom Event Labels

Rename events in the UI without code changes. Turn "btn_clk_upgrade" into "Upgrade Button Click" for your whole team.

👁️

Event Visibility

Hide noisy events from the UI without deleting data. Internal events, debug events, or deprecated tracking - out of sight, still queryable.

Property Management

Mark properties as verified, hidden, or marketing. Your team knows which properties are trustworthy and which are still being validated.

Data Retention Controls

Configurable retention per tenant. Automated nightly cleanup enforces your limits. Set it once, never worry about it.

🛡️

PII Tools

Lookup, export, anonymize, and delete user data. Built-in GDPR/CCPA compliance - no Zendesk tickets, no engineering requests.

📤

CSV Import

Import firmographics, account metadata, and user attributes via CSV. Enrich your analytics with CRM data in minutes.

📦

Multi-Product

Track multiple products in separate workspaces with one login. Customer app, admin portal, mobile app - isolated data, unified access.

🔎

Event Properties Explorer

Drill into any event type to see its properties, fill rates, and top values. Debug tracking issues without touching raw data.

One filter. Every report.

Eight filter types are available on every analytics page. Set a filter on the dashboard and it follows you to Trends, Funnels, Retention - everywhere. Click an account name and instantly see all reports scoped to that account.

Account User Segment Industry Company Size Firm Segment Revenue Range CS Owner

These aren't just dashboard filters. Signals respects them. Discoveries filters by them. Exports include them. The whole platform speaks the same filtering language.

Start analyzing tonight.

One script tag. Free during early access. Your first dashboard loads in minutes.

Get Early Access →